12 Multi-View RGB Phenotyping Instrument – PHENOBox
Image gallery:
Contact:
Vienna BioCenter Core Facilities GmbH (VBCF)
Plant Sciences Facility (PlantS)
Dr. Bohr Gasse 3
1030 Vienna
Austria
Email: sebastian.seitner@vbcf.ac.at
Phone: +43 1 7962324 7980
Web: https://www.viennabiocenter.org/vbcf/plant-sciences/
Key facts:
Description:
| Name | PHENOBox |
|---|---|
| Location | Vienna BioCenter (VBC), Vienna. |
| Category | Bench instrument, low-throughput, manual sample loading |
| Environment | No environmental control; can be placed in a phytotron. |
| Sensors | RGB, side-view and multi-view |
| Traits | Morphological and colour traits |
| Capacity | 1 pot at a time |
| Limitations | Low-throughput, manual sample loading, only side-view RGB imaging. |
| References | Czedik-Eysenberg A, Seitner S, Güldener U, Koemeda S, Jez J, Colombini M, Djamei A. (2018) The ‘PhenoBox’, a flexible, automated, open-source plant phenotyping solution. New Phytologist DOI: https://doi.org/10.1111/nph.15129 |
| URL | https://www.viennabiocenter.org/vbcf/plant-sciences/phenobox/ |
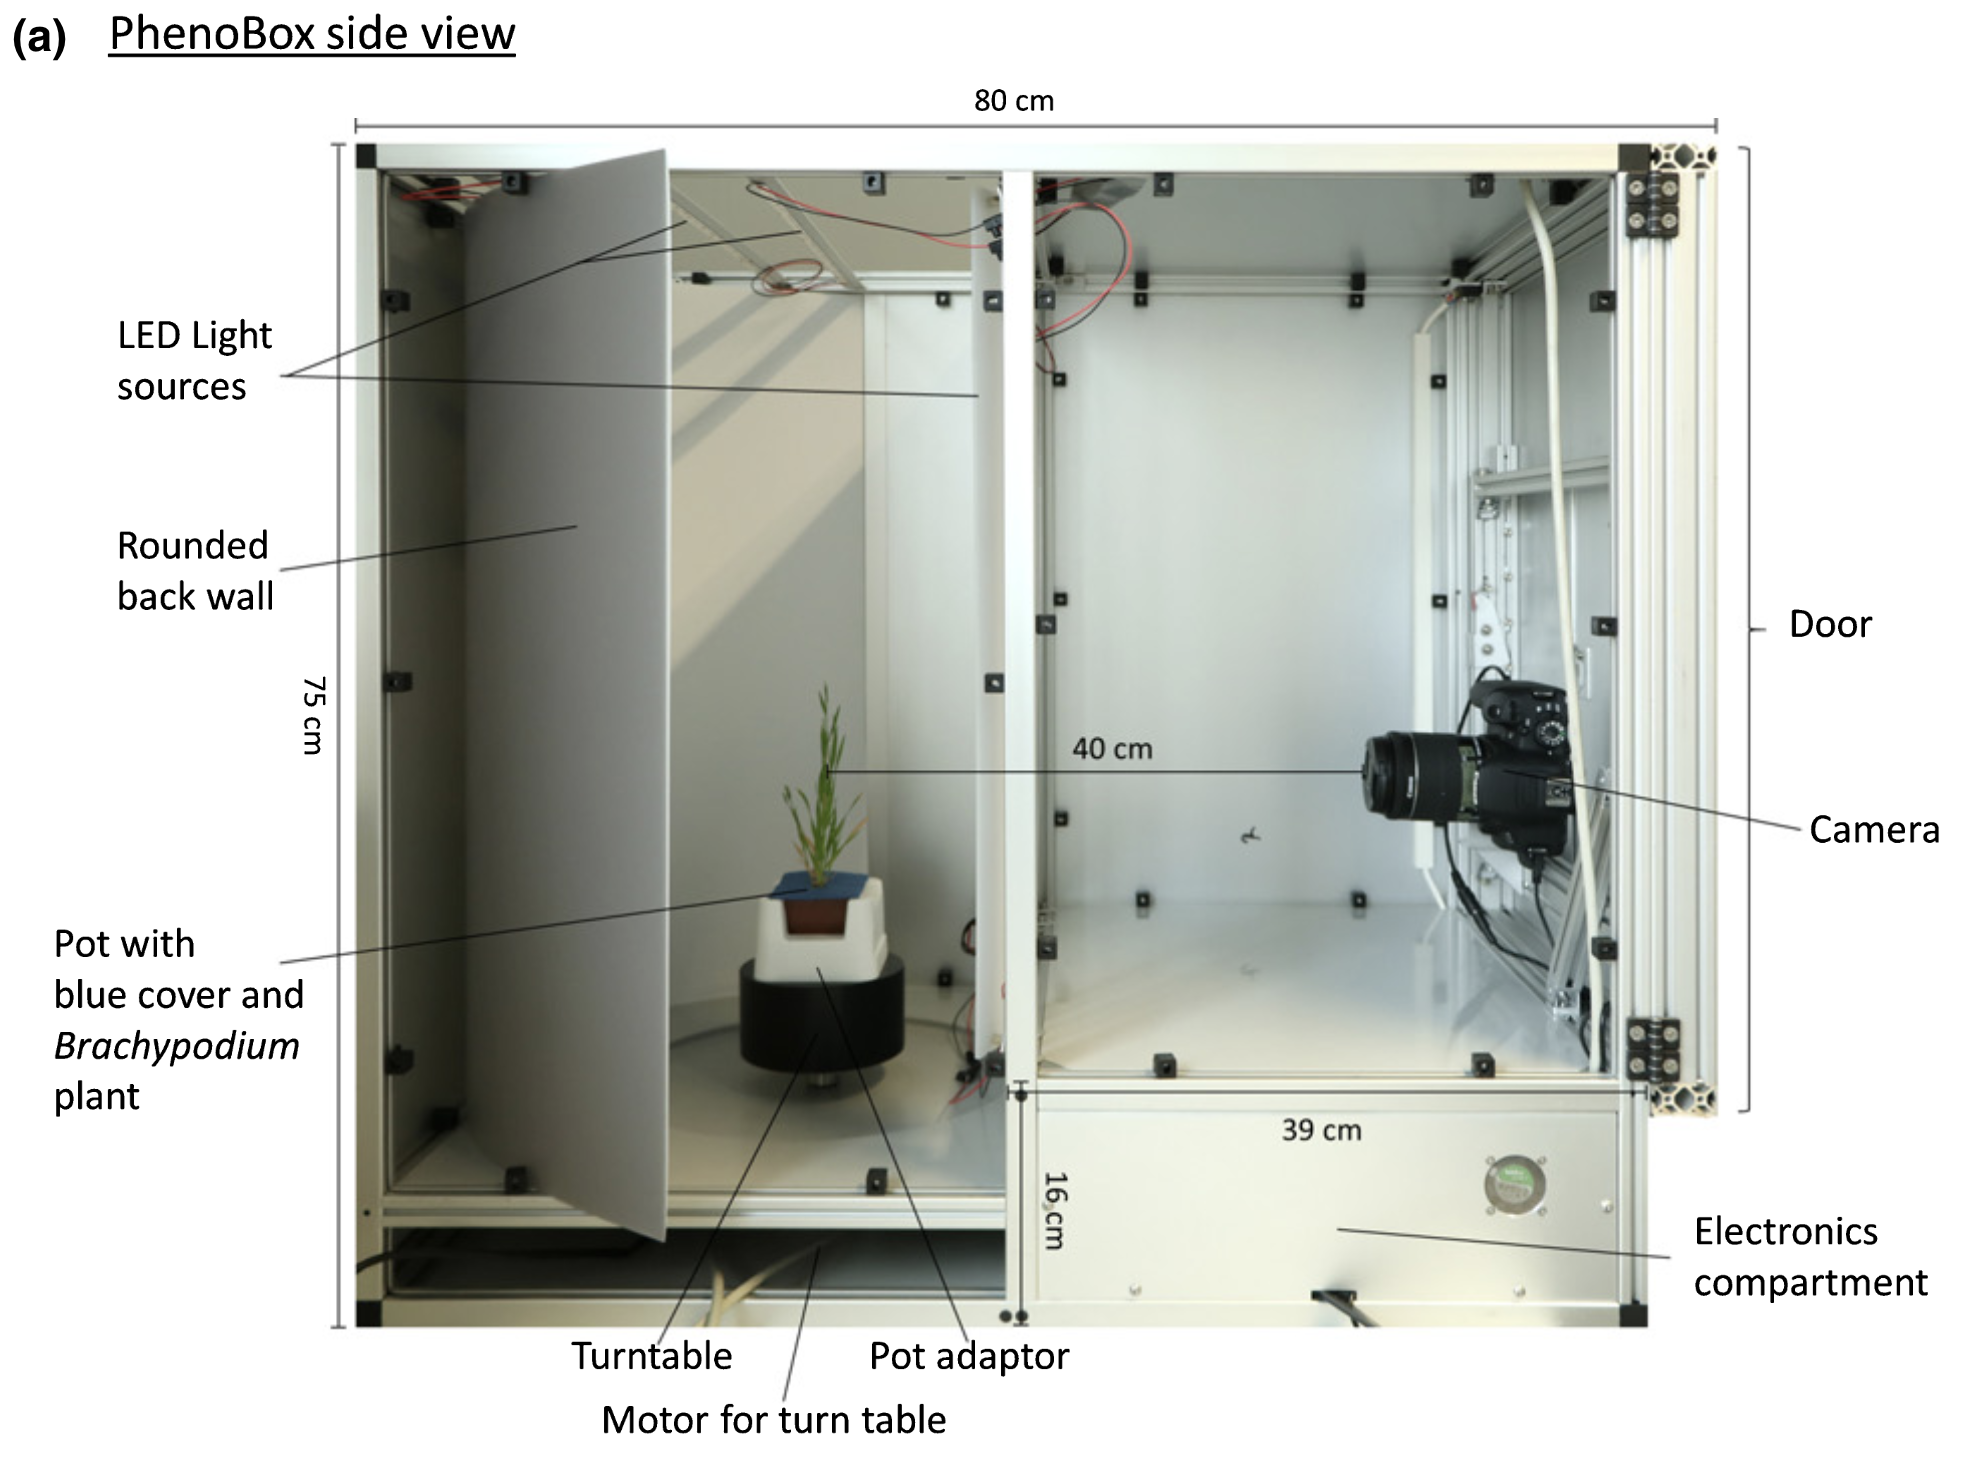
PHENOBox is a flexible open hardware/open source phenotyping system for the evaluation of visual shoot traits. Our system consists of the ‘PhenoBox’, a chamber that automatically captures and processes plant images from different angles, and the sample management and evaluation framework ‘PhenoPipe’, which submits images for feature extraction and subsequently for statistical analyses through pre-supplied as well as custom evaluation modules written in the statistical programming language R. We demonstrate the versatility of our system by providing examples of its use to study two biotic stress situations and one abiotic stress situation in three different plant species: first, we show that we can predict qualitative infection outcome in the model grass B. distachyon infected with the head smut fungus Ustilago bromivora based on changes in visual features during the early vegetative growth phase, weeks before qualitative symptom development. Second, we used our system to compare quantitative responses in shoot phenotypic traits in maize plants infected with a fully capable U. maydis strain and with effector mutant strains. We propose the calculation of multi-dimensional distances between plant groups based on principal components derived from visual traits as a method to quantitatively compare phenotypic impact between different treatments. Finally, we illustrate the wider applicability of our system to a dicot model and abiotic stress situation by studying the effects of salt stress on Nicotiana benthamiana. We show that we can sensitively identify different classes of responses which are in line with published salinity response phenotypes. This experiment is summarized in the form of a tutorial on how to use the PhenoBox/PhenoPipe system. Overall, we expect that our PhenoBox/PhenoPipe system will help fill the gap in affordable, flexible, automated phenotyping solutions and thus open new approaches to study biotic and abiotic stress responses in plants.